Presentation of the results
Access to the Analysis Page
Access to the pollutant concentration data analysis page is provided through the webGIS interface based on Lizmap.
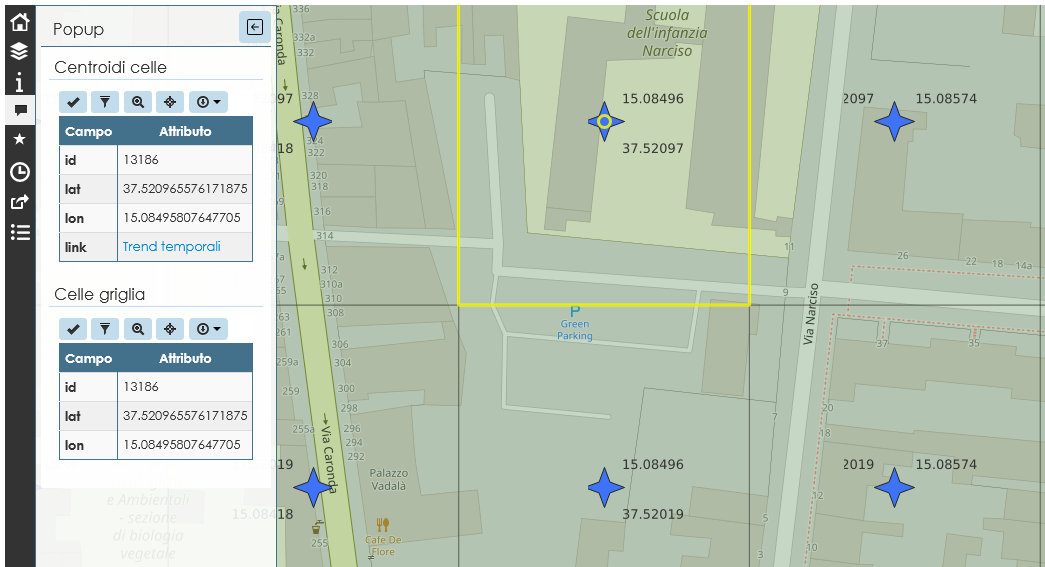
By activating the Grid cells layer, the user can view the cells that make up the analysis area. Beyond a certain zoom level, the Cell centroids layer is also activated. Switching to the popup tool allows clicking on the centroid of interest. A table appears where the Time trends link directs to the analysis page for the specific cell containing the centroid in question.
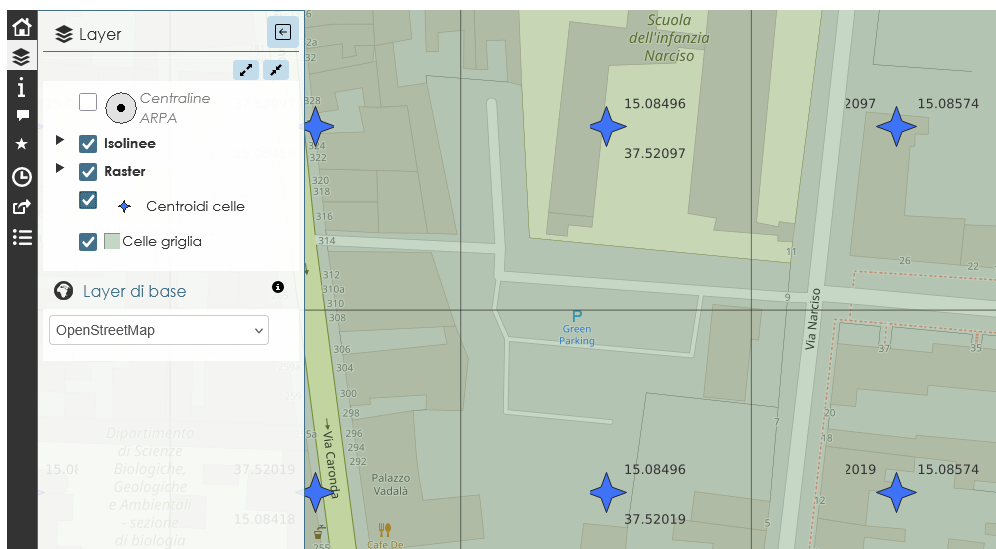
 Visualization of cell centroids (left) and centroid query with link
to the analysis page (right).
Visualization of cell centroids (left) and centroid query with link
to the analysis page (right).
Standard Time Charts (2D)
Upon loading the page, the system uses the cell ID sent by the webGIS interface to initialize six chart instances rendered in SVG vector format to maximize text sharpness, interactivity, and layout scalability.
- Daily Charts: represent the detailed hourly trends of NO2, O3, PM10, PM2.5, and SO2 concentrations on a single day selected by the user.
- Average Charts (Avg): analyze historical averages aggregated over three distinct time scales: daily (with smart zoom sliders), monthly, and annual.
- Maximum Charts (Max): show the maximum values recorded within the same temporal aggregations to monitor compliance with regulatory limits.
 Monthly average concentration of NO2, O3,
PM10, PM2.5, and SO2 for the years
2024 and 2025.
Monthly average concentration of NO2, O3,
PM10, PM2.5, and SO2 for the years
2024 and 2025.
Statistical Processing Algorithms
The system performs mathematical calculations directly client-side to determine the trend and robustness of linear relationships between different pairs of sampled pollutants, with particular reference to photochemical interaction phenomena.
- Pearson Correlation Coefficient: calculates the linear correlation index between two variables instantaneous point by point, returning a value between -1 and +1, or null if the number of data points is less than 2.
- Statistical Significance (p-value): determines the statistical robustness of the correlation by extracting Student's t statistic and calculating its two-tailed approximation with n-2 degrees of freedom.
- Significance Levels: visually categorizes results into the four standard intervals of scientific literature: *** (p < 0.001), ** (p < 0.01), * (p < 0.05), or n.s. (not significant).
Advanced Analysis and 3D Visualizations
Clicking the photochemical calculation button triggers an asynchronous AJAX request that transmits the selected time filters and generates an Hour × Month correlation matrix, which simultaneously feeds multiple advanced visualization modes.
- Two-Dimensional Scatter Plot: displays data point dispersion to highlight the photochemical anticorrelation effect, supporting dynamic color changes based either on the month palette or the hour of the day.
- Cartesian 3D Histogram: leverages ECharts GL to generate three-dimensional bars arranged along Hour and Month axes, where the height and divergent color (from blue to red) reflect the value of the Pearson r index.
- Radial Surface Chart: a 3D spatial projection where polar coordinates map concentric circles for months and guide rays for hours, overlaid by a continuous surface that reflects the correlation trend.

 Photochemical anticorrelation between NO2 and O3:
hourly characterization (left) and monthly characterization (right).
Photochemical anticorrelation between NO2 and O3:
hourly characterization (left) and monthly characterization (right).
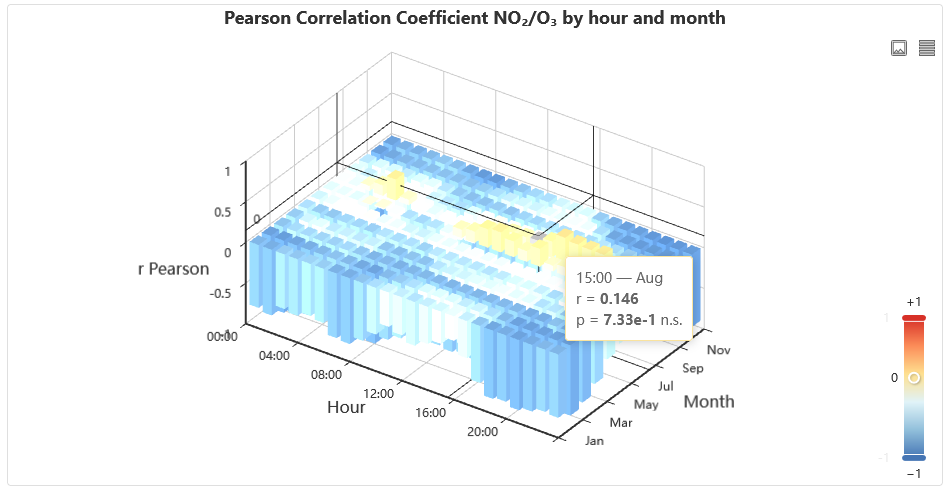 Cartesian 3D histogram of the Pearson r index.
 Radial surface chart of the Pearson r index.
The Toroidal Model
The system models the Hour × Month matrix onto the geometry of a torus (donut), elegantly resolving the temporal continuity problem where the end of a cycle fluidly reconnects to the beginning of the next one.
- Temporal Continuity: the major ring of the torus seamlessly connects 23:00 to 00:00, while the circular section of the tube closes the transition between the month of December and January.
- Color Mapping: colors the vertices of the geometric mesh applying a divergent scale from dark blue (strong anticorrelation) to deep red (strong positive correlation), passing through yellow as the neutral point.
- Label Occlusion Management: utilizes a Raycasting algorithm that computes the line of sight from the camera to each hourly or monthly label (CSS2DRenderer), hiding them by setting opacity to zero if the torus structure visually interposes.
- Interactivity and Tooltips: enables three-dimensional rotation via mouse dragging and integrates a raycaster to intercept the geometric surface, displaying an informative popup with the precise hour, month, r-value, and corresponding p-value.
 Toroidal model of the Pearson r index.