UISH — Urban Intelligence Science Hub for City Network
A portal for the analysis of air-quality data and the validation of the pollutant concentrations computed by the model, within the UISH project of the Italian National Research Council (CNR).
The project
The Urban Intelligence Science Hub for City Network (UISH) is a CNR project, funded under the PON METRO programme (Agency for Territorial Cohesion), that develops an innovative approach to the digital analysis of complex urban realities in support of city planning and management decisions. The Urban Intelligence paradigm conceived by the CNR integrates an ecosystem of digital technologies into a digital twin of the city, fed by multiple sensory sources and aimed at the goals of the UN Agenda 2030 (urban environment, sustainability and resilience, quality of life, local development, social inclusion).
The city of Catania is the pilot case study. Among the priority topics addressed by the project are mobility, air quality, cultural heritage, the livability of the historic centre and its interaction with the port area. The approach is modular: the digital city model is first developed on a limited part of the territory and on a few subsystems (such as mobility and air pollution), and then progressively extended.
The CNR institutes involved
The project is coordinated by the Institute of Atmospheric Sciences and Climate (ISAC) and involves twelve CNR institutes:
- Institute for System Analysis and Computer Science «Antonio Ruberti» (IASI)
- Institute for High Performance Computing and Networking (ICAR)
- Institute of Electronics, Computer and Telecommunication Engineering (IEIIT)
- Institute of Applied Physics «Nello Carrara» (IFAC)
- Institute of Atmospheric Pollution Research (IIA)
- Institute for Applied Mathematics and Information Technologies «Enrico Magenes» (IMATI)
- Institute for Electromagnetic Sensing of the Environment (IREA)
- Institute of Atmospheric Sciences and Climate (ISAC)
- Institute of Cognitive Sciences and Technologies (ISTC)
- Construction Technologies Institute (ITC)
- Institute for Complex Systems (ISC)
- Institute of Marine Engineering (INM)
CNR-IFAC's activity
The Institute of Applied Physics «Nello Carrara» (CNR-IFAC) contributes to UISH with the activity line «Use of satellite data for the analysis and forecasting of urban air quality» (lead: Ugo Cortesi). The activity exploits the satellite data of the EU Copernicus Programme and the CAMS service (Copernicus Atmosphere Monitoring Service) to analyse and forecast air quality at the urban scale, enriching the air-quality digital twin of the city of Catania.
This portal is the operational tool through which IFAC carries out the analysis of the monitoring data of Catania and the validation of the pollutant concentrations (NO2, O3, PM10, PM2.5, SO2) computed by the model over the urban grid, comparing them with the station measurements through a set of statistical indices and diagrams.
The AIR-Portal model and the collaboration with S[&]T
The pollutant concentrations over the urban grid are computed with the AIR-Portal model, developed by Science [&] Technology Corporation (S[&]T), based in Delft (the Netherlands). AIR-Portal combines, through data fusion techniques, satellite observations, in-situ measurements, traffic data and forecast models: it starts from the regional CAMS data (~10 km resolution) and downscales them to the urban resolution of 69×86 m at hourly step, using GIS data (road network, vegetation) and land-use scale factors that reflect the daily and weekly cycles of traffic emissions; local measurements calibrate the result, reducing the model bias. The product includes maps of NO2, O3, PM10, PM2.5, SO2 and of the Air Quality Index (AQI), in NetCDF and GeoTIFF formats.
CNR-IFAC's collaboration with S[&]T is not new: the first international use of AIR-Portal took place in the European project H2020 AURORA, coordinated by CNR-IFAC with S[&]T as industrial partner, with a pilot project on the city of Florence.
The data pipeline: from netCDF to the webGIS
From the model product to the online consultation, the data follow a chain entirely managed within UISH:
netCDF
Hourly concentrations provided by AIR-Portal (NO₂, O₃, PM₁₀, PM₂.₅, SO₂) over the Catania domain.
PostgreSQL / PostGIS
Python scripts read the netCDF and write cells, centroids and the five concentration arrays; daily, monthly and yearly aggregates are pre-computed.
Isolines (vector)
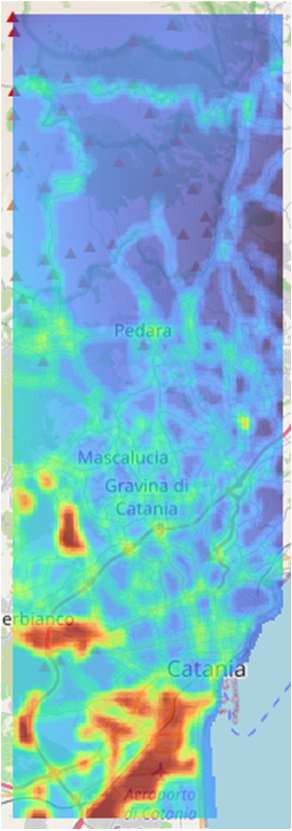
Inside the database the isolines are computed per pollutant, statistic and period, materialised as PostGIS views.
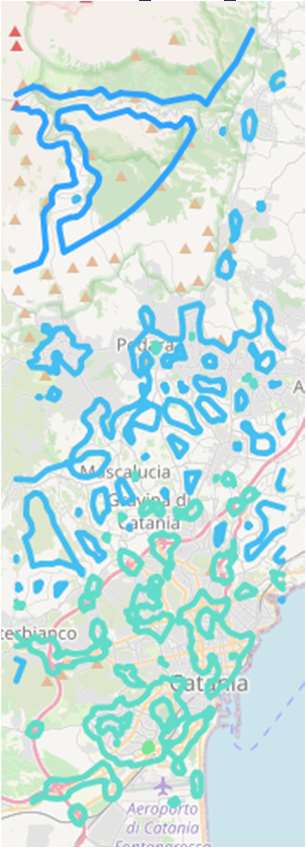
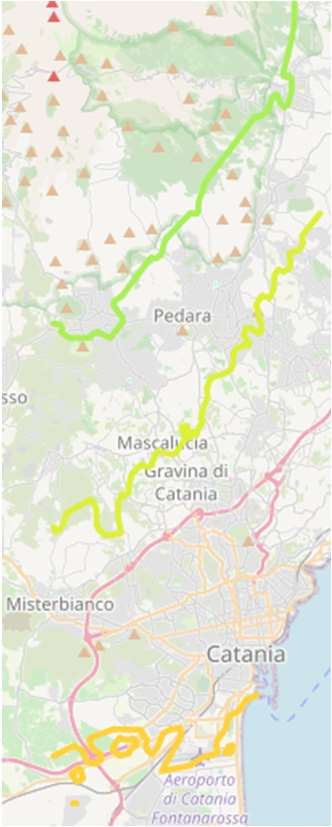
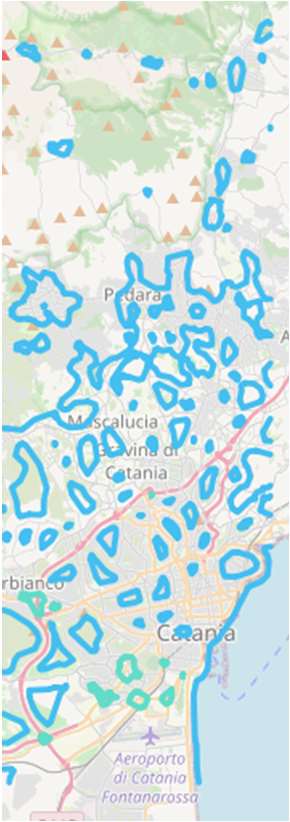
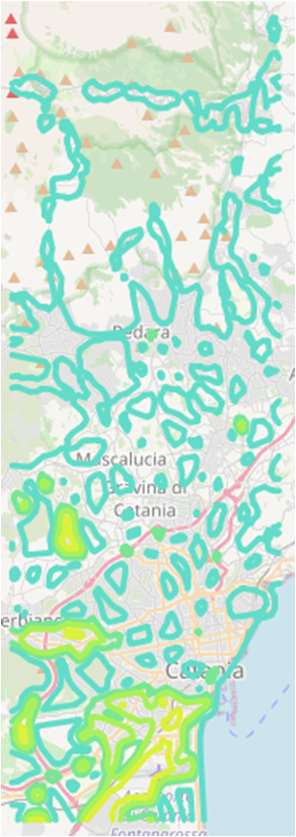
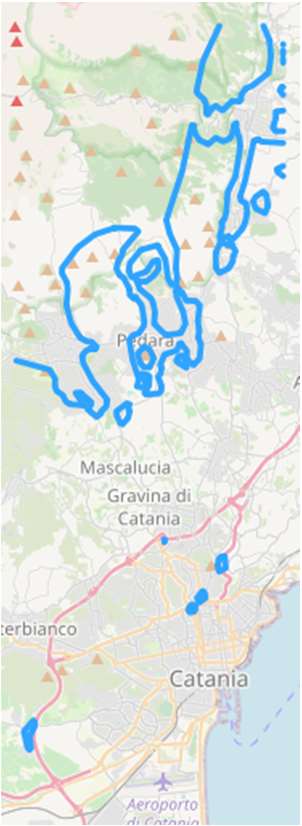
One isoline layer per pollutant, computed inside the database.
Raster export (Python)
Python software exports the rasters (yearly mean/maximum) for a continuous rendering of the concentrations.
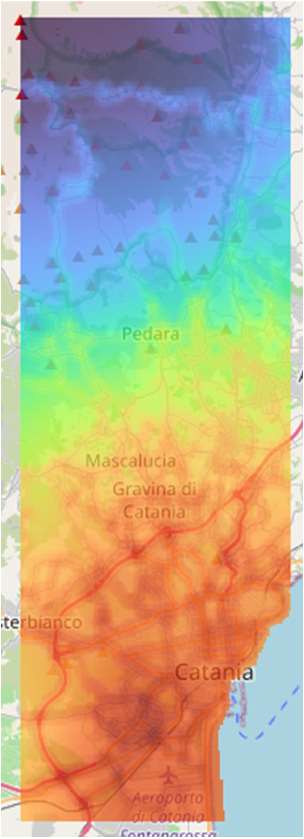
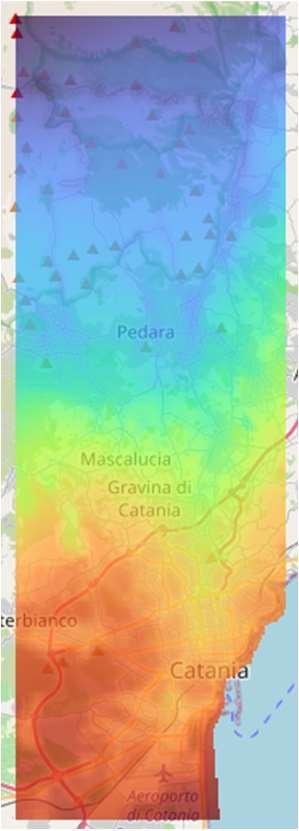
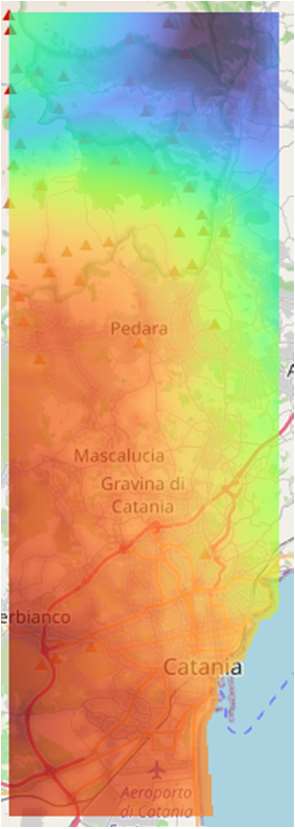
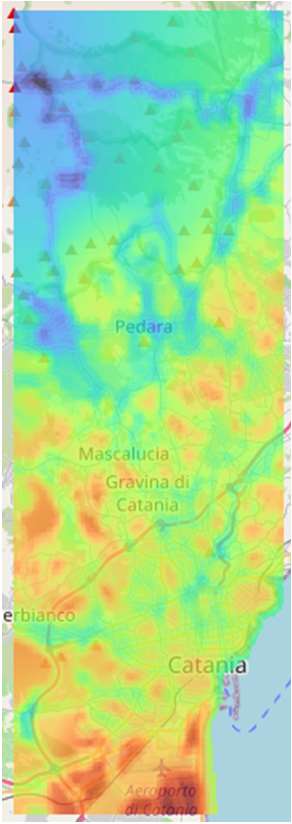
The matching raster rendering: a continuous field for each pollutant.
webGIS
Vector and raster layers published with QGIS Server + Lizmap, with a daily timeline and per-pollutant legends.
- Acquisition. The hourly concentrations (NO2, O3, PM10, PM2.5, SO2) for 2024 and 2025 are provided by AIR-Portal in netCDF format over the Catania domain (Etna–airport), an area of 10×30 km divided into a grid of 51,303 cells that are square in geographic coordinates (side ≈ 2.81″): at Catania's latitude (~37.5° N) each cell spans about 69 m east–west and 86 m north–south.
- Database population. Python scripts read the netCDF files and write them into PostgreSQL/PostGIS: the geometry and centroids of the cells; for each hour, the values of the five pollutants in five arrays in the concentrations table. From these, mean and maximum aggregates are pre-computed daily, monthly and annually.
- Isolines (vector data). From each aggregate the isolines are generated for every pollutant, statistic (mean/maximum) and period (day/month/year), materialised as PostGIS materialized views.
- Raster (netCDF). From the same aggregates, raster netCDF files (annual mean/maximum) are produced for a continuous rendering of the concentrations.
- Visualisation. The vector and raster layers are published in the webGIS (QGIS Server + Lizmap), with a daily-step timeline for the isolines and standard per-pollutant legends; performance is optimised with GIST indices in PostGIS, parallel FastCGI, MapProxy and Redis.
- Analysis. From the webGIS, clicking a centroid opens the point's time-trend page (hourly concentrations and daily/monthly/annual means and maxima) and the model validation tools.
Browse the portal
Data Analysis
Data exploration: webGIS, time trends, monitoring data, correlation with the volcanic activity of Mt. Etna and theoretical and statistical background.
Validation
Model-vs-observation comparison: the chart dashboard, the documentation of the chart functions and of the statistical validation indices.
Scientific bibliography
- Castelli, G. et al. (2022). Urban Intelligence: Toward the Digital Twin of Matera and Catania. 2022 IEEE International Workshop on Blockchain for Renewables Integration (BLORIN). doi:10.1109/BLORIN54731.2022.10028437
- Cortesi, U. et al. (2018). Advanced Ultraviolet Radiation and Ozone Retrieval for Applications (AURORA): A Project Overview. Atmosphere, 9(11), 454. doi:10.3390/atmos9110454
- Inness, A. et al. (2019). The CAMS reanalysis of atmospheric composition. Atmospheric Chemistry and Physics, 19(6), 3515–3556. doi:10.5194/acp-19-3515-2019
References
- CNR — UISH — Urban Intelligence Science Hub for City Network (project page)
- CNR-ISAC — UISH — Urban Intelligence Science Hub for City Network
- CISC — UISH project
- PON METRO — ponmetro.it
- H2020 AURORA project — aurora-copernicus.eu
- Science [&] Technology (S[&]T) — stcorp.nl
- Copernicus Programme — copernicus.eu
- Copernicus Atmosphere Monitoring Service (CAMS) — atmosphere.copernicus.eu
Keywords: UISH, Urban Intelligence, CNR, IFAC, air quality, Catania, AirPortal, S&T, digital twin